Without doubt, 2015 has been a big year for Google updates. These updates have promoted a lot of positive changes in the realm of digital marketing, and in particular to practices in Search Engine Optimization. We will remember 2015 to be the year of many memorable Google updates, such as the Mobile Armageddon, Mobile App Indexing, Google Maps Googlebomb, and the introduction of Google’s artificial intelligence, RankBrain.
While we still can’t possibly know every detail about the inner workings of Google’s algorithm, as SEO specialists we hypothesize and test different theories about the factors which are suspected to influence Google’s rankings. Not much has changed in terms of overall SEO strategies, but some priorities have definitely shifted.
Why is Email Outreach so Important in 2016?
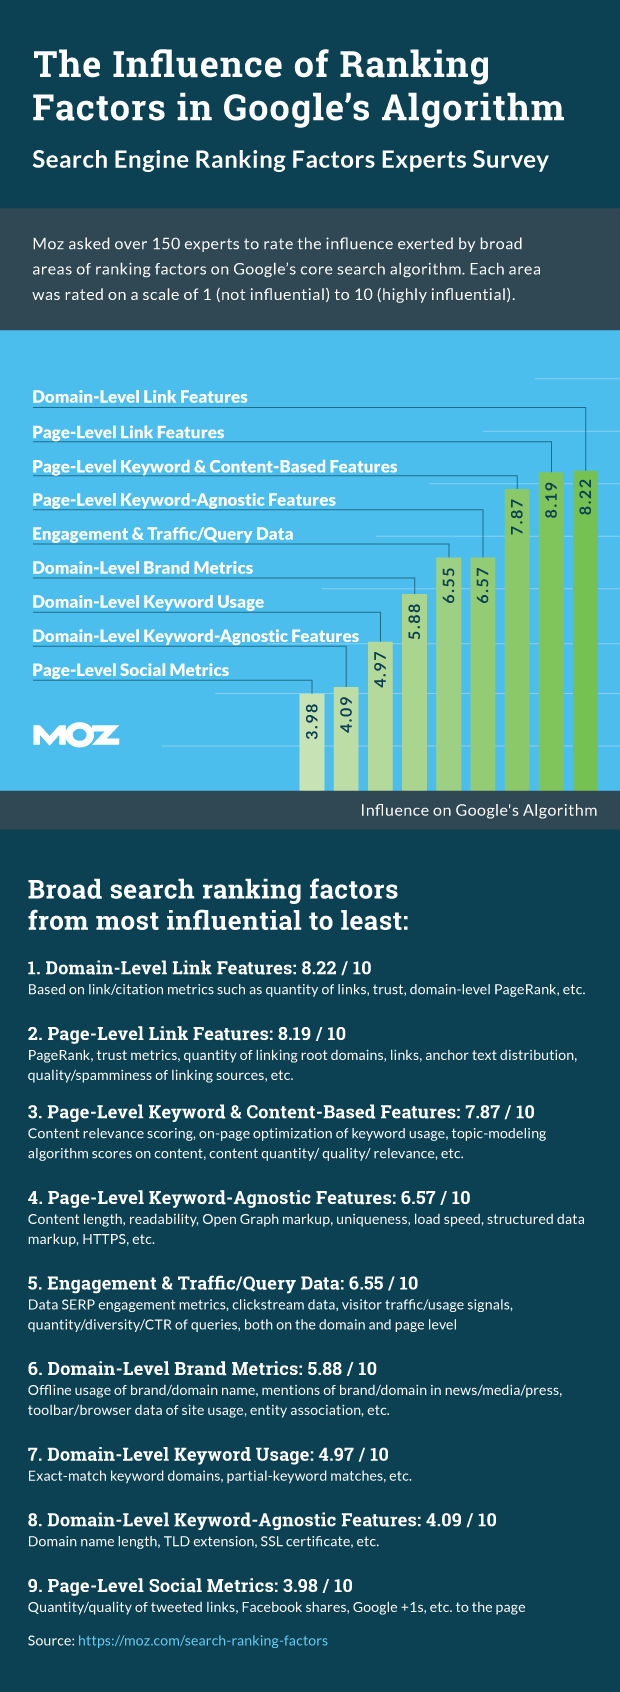
As we know, there are well over 200 ranking factors, which make up Google’s algorithm. Every year industry professionals get together to participate in Moz Search Rankings Factors survey, where 150 experts rate the influence of each ranking factor in terms of importance. The top 9 ranking factors were the following:
- Domain-Level Links
- Page-Level Links
- Page-Level Keywords & Content-Based Features
- Page-Level Keyword-Agnostic Features
- Engagement & Traffic/Query Data
- Domain-Level Brand Metrics
- Domain-Level Keyword Usage
- Domain-Level Keyword-Agnostic Features
- Page-Level Social Metric
Based on the latest results, we can see that the top 2 voted factors which influence Google’s rankings, remain to be link-building. However, the same old and over-used link building tactics which may have worked years ago, are fairly ineffective in today’s time. If think that blog commenting or forum posting will get you somewhere, think again. There is a continuing importance of high quality link-building which can usually only be achieved through guest posting, broken link-building, link-bait articles, etc. Because of the shift towards high-quality links is becoming more and more important for a sustainable long term SEO strategy, the need for effective outreach emails to acquire these links has never been more important. There are endless opportunities for using outreach emails for link-building, so get yourself ready for 2016 and find out what it takes to have an effective email outreach strategy.
Let’s take a look some General Email Data and Statistics
Mailchimp is one of the most popular platforms for e-mail marketing for all types of businesses. From small start-ups, to Fortune 500 companies, Mailchimp has collected and published data from businesses in 47 different industries. This data can become a valuable resource for marketers and business owners that want to benchmark the success of their own e-mailing campaigns. While this data is more general, it can also serve as a good benchmark for Outreach Emails. User behavior tends to be is very similar when it comes to emails, whether it is a sales email or an outreach email.
The compiled a list of data from 47 different industries includes data of Open Rates, Click-Through-Rates, Soft Bounces, Hard Bounces, Abuse Reports and Unsubscribes.
Email Benchmark Data
| Industry | Open | Click | Soft Bounce | Hard Bounce | Abuse | Unsub |
|---|---|---|---|---|---|---|
| Agriculture and Food Services | 25.33% | 3.30% | 0.63% | 0.48% | 0.03% | 0.28% |
| Architecture and Construction | 25.15% | 3.06% | 1.58% | 1.12% | 0.04% | 0.36% |
| Arts and Artists | 27.58% | 2.91% | 0.70% | 0.51% | 0.03% | 0.27% |
| Beauty and Personal Care | 19.09% | 2.18% | 0.47% | 0.45% | 0.04% | 0.33% |
| Business and Finance | 21.49% | 2.79% | 0.73% | 0.59% | 0.03% | 0.24% |
| Computers and Electronics | 21.33% | 2.39% | 1.07% | 0.74% | 0.03% | 0.30% |
| Construction | 22.52% | 1.99% | 1.68% | 1.32% | 0.05% | 0.44% |
| Consulting | 19.70% | 2.48% | 0.97% | 0.74% | 0.03% | 0.28% |
| Creative Services/Agency | 22.76% | 2.81% | 1.14% | 0.90% | 0.03% | 0.36% |
| Daily Deals/E-Coupons | 13.70% | 1.84% | 0.13% | 0.08% | 0.01% | 0.10% |
| eCommerce | 16.78% | 2.52% | 0.33% | 0.25% | 0.03% | 0.21% |
| Education and Training | 22.11% | 2.82% | 0.59% | 0.50% | 0.02% | 0.20% |
| Entertainment and Events | 21.60% | 2.41% | 0.54% | 0.44% | 0.03% | 0.27% |
| Gambling | 16.55% | 2.97% | 0.39% | 0.45% | 0.03% | 0.15% |
| Games | 21.70% | 3.29% | 0.51% | 0.53% | 0.03% | 0.23% |
| Government | 26.47% | 3.66% | 0.53% | 0.42% | 0.02% | 0.12% |
| Health and Fitness | 22.62% | 2.89% | 0.49% | 0.48% | 0.04% | 0.37% |
| Hobbies | 28.91% | 5.47% | 0.36% | 0.28% | 0.03% | 0.22% |
| Home and Garden | 24.90% | 3.87% | 0.67% | 0.46% | 0.04% | 0.37% |
| Insurance | 20.25% | 2.14% | 0.76% | 0.81% | 0.04% | 0.23% |
| Legal | 22.70% | 2.98% | 0.79% | 0.66% | 0.02% | 0.22% |
| Manufacturing | 22.92% | 2.55% | 1.50% | 1.02% | 0.04% | 0.35% |
| Marketing and Advertising | 18.44% | 2.12% | 0.83% | 0.66% | 0.03% | 0.28% |
| Media and Publishing | 22.39% | 4.61% | 0.31% | 0.20% | 0.01% | 0.12% |
| Medical, Dental, and Healthcare | 22.77% | 2.56% | 0.80% | 0.79% | 0.04% | 0.29% |
| Mobile | 20.07% | 2.22% | 0.69% | 0.68% | 0.03% | 0.38% |
| Music and Musicians | 22.99% | 2.92% | 0.64% | 0.47% | 0.03% | 0.29% |
| Non-Profit | 25.38% | 2.88% | 0.53% | 0.44% | 0.02% | 0.19% |
| Other | 23.36% | 2.99% | 0.85% | 0.65% | 0.03% | 0.27% |
| Pharmaceuticals | 20.31% | 2.72% | 0.79% | 0.72% | 0.03% | 0.21% |
| Photo and Video | 26.71% | 4.03% | 0.79% | 0.65% | 0.03% | 0.39% |
| Politics | 23.08% | 2.37% | 0.48% | 0.44% | 0.03% | 0.20% |
| Professional Services | 21.01% | 2.70% | 0.94% | 0.72% | 0.03% | 0.30% |
| Public Relations | 20.12% | 1.72% | 0.80% | 0.61% | 0.02% | 0.22% |
| Real Estate | 21.77% | 2.06% | 0.71% | 0.59% | 0.05% | 0.32% |
| Recruitment and Staffing | 20.03% | 2.34% | 0.56% | 0.57% | 0.03% | 0.30% |
| Religion | 26.29% | 3.30% | 0.22% | 0.19% | 0.02% | 0.12% |
| Restaurant | 22.34% | 1.29% | 0.31% | 0.26% | 0.02% | 0.29% |
| Restaurant and Venue | 22.29% | 1.42% | 0.62% | 0.53% | 0.03% | 0.40% |
| Retail | 21.62% | 2.69% | 0.42% | 0.35% | 0.03% | 0.28% |
| Social Networks and Online Communities | 21.95% | 3.54% | 0.42% | 0.33% | 0.02% | 0.23% |
| Software and Web App | 21.57% | 2.46% | 1.12% | 0.87% | 0.03% | 0.39% |
| Sports | 26.04% | 3.56% | 0.55% | 0.47% | 0.03% | 0.27% |
| Telecommunications | 21.49% | 2.50% | 1.22% | 0.92% | 0.03% | 0.28% |
| Travel and Transportation | 20.74% | 2.35% | 0.70% | 0.51% | 0.03% | 0.24% |
| Vitamin Supplements | 17.32% | 1.97% | 0.41% | 0.31% | 0.04% | 0.26% |
Source: http://mailchimp.com/resources/research/email-marketing-benchmarks/
Email Outreach Data and Statistics
A study by iAcquire sent out 300,000 outreach emails to test what makes a successful outreach email, by measuring 13 different philosophy-agnostic questions for the purpose of the study.
Table of Contents
- Which gender performs best?
- How many emails (until a response or a close)?
- What day and time of day is best to send an email?
- How did email trust signals such as logos, phone numbers and links to profiles affect performance?
- How did emails with generic opening salutations perform?
- How did emails with specific opening salutations perform?
- How do long vs short emails perform (over or under 1000 characters)?
- How did correspondence that began from Twitter perform?
Which Gender Performs Best at Email Outreach?
Analysis
Based on the study, the data showed that women have a higher response rate by 2.1%. They however have slightly lower closing rates than men by 0.31%.
Insight & Action
There isn’t a huge disparity between the different sexes’ closing rates (how many links were successfully obtained). At a negligible 0.31%, whether you use a gender specific persona for link-building, or are debating hiring a specific gender of outreach professionals, the focus should be on the person’s ability or developing their skills, and not their sex.
How Many Emails Should You Send Till You Get a Response or Close?
Analysis
Email outreach should not end at the first email. While the largest percentage of responses come from the first email, the study suggests that there is as much as a 60% increase in responses after the second and third email. Needless to say, persistence is key.
Insight & Action
Persistence wins all, so continue to send emails until you receive a rejection. Remember to be respectful and not spam either. To simplify the outreach process schedule follow-up emails using a tool like Boomerang.
What is the Best Day & Time of Day to Send an Outreach Email?
Analysis
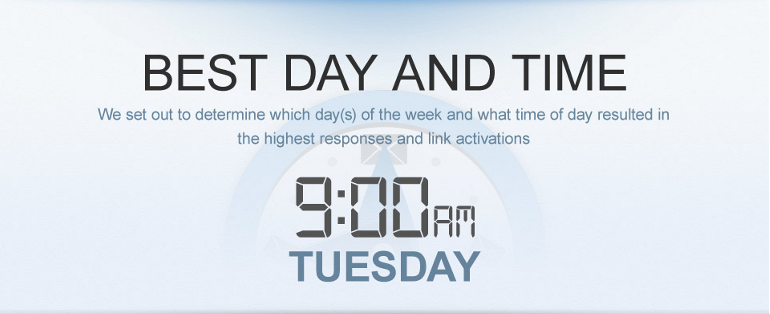
Data shows that that emails sent at 4 AM, 6 AM and 9 AM EST have the highest rate of response and emails sent at 4 AM, 5 AM and 9 AM EST have the highest rate of link acquisition. Email’s sent out on Mondays and Thursdays had the two best response rates, while Tuesday and Wednesday were tied for third. Tuesdays had the best results for emails to acquire the link, followed by a tie for second place by Monday and Wednesday.
Insight & Action
The study suggests that the best time to send emails fall in-between 10 PM and 9 AM. Since there is a lower volume of emails being sent out at night, it is more likely that the email recipient will read and respond to the email before “email fatigue” kicks in. The absolute most optimal time to send outreach emails is at 9:00 AM on a Tuesday. Using tools such as Boomerang will help you schedule emails to be sent between the most optimal times and days. Alternatively you could hire virtual assistants in different time zones, where 10 PM to 9 AM EST is during working hours.
How do email trust signals such as logos, phone numbers and links to profiles affect performance?
Analysis
The study looked at the effect of using logos, phone numbers and linked social media profiles, to prove the individual is a real person, and not just automated spam.
- Emails without phone numbers got 4.78% more responses, and 2.48% more link closes than ones with a phone number.
- Not including social media profiles linked in the footer closed 4.98% of the prospects, while the outreach emails with the linked profiles only closed at 4.33%.
- Linked logos have the highest close rate at 10.58%, followed by embedded logos at 6.03%. Not including a logo closed at 3.72%.
Insight & Action
- Remove phone numbers from the emails, unless they are asked for.
- There is a negligible difference between including and not including social profiles. It’s best to not include them.
- Logos work as the best trust signals, and should be included in every email for the respective brand which you are link-building for.
How did emails with generic opening salutations perform?
Analysis
Out of all generic salutations, a simple “Hi” performs the best. It has a response rate of 17.47% and a closing rate if 5.62%. “Hello” comes next in line at 14.37% response rate and 4.14% close rate.
Insight & Action
Having a more personal salutation goes a long way, and it is always worth investing the time into finding the name of the email prospect. Using tools like Rapportive or TowerData will help find that information.
How did emails with specific opening salutations perform?
Analysis
Personal greetings perform 2.41% better than general greetings, with 6.5% closing rates.
Insight & Action
Using a greeting such as “Hi David” or “Hi David Splice,” will convert better than just a simple “Hi.” Take a time to find the correct information about the individual you are contacting, as a personal greeting has a much greater rate of success for both email responses and closing. Tools such as Rapportive or TowerData will help in finding out that information.
How do long vs short emails perform (over or under 1000 characters)?
Analysis
Longer emails have a higher response and closing rate. Emails which are over 1,000 characters have a response rate of 16.47% and closing of 5.41%, which short emails, under 1,000 characters only have a response rate of 14.93% and closing of 4.32%
Insight & Action
Longer emails usually included more personalized details and more specifics about content partnership opportunities. This resulted in better results. Replace your cookie cutter email templates and take the time to personalize each email.
How did correspondence that began from Twitter perform?
Analysis
While the data is not statistically significant, there is a definite correlation between the effectiveness of building a relationship on Twitter, prior to contacting the prospect via email. There was a 37.5% response rate for emails which Tweeted first before emailing.
Insight & Action
Building relationships by engaging prospects with relevant information on Twitter is an effective way to boost your outreach success.
Example of Writing the Ultimate Outreach Email?
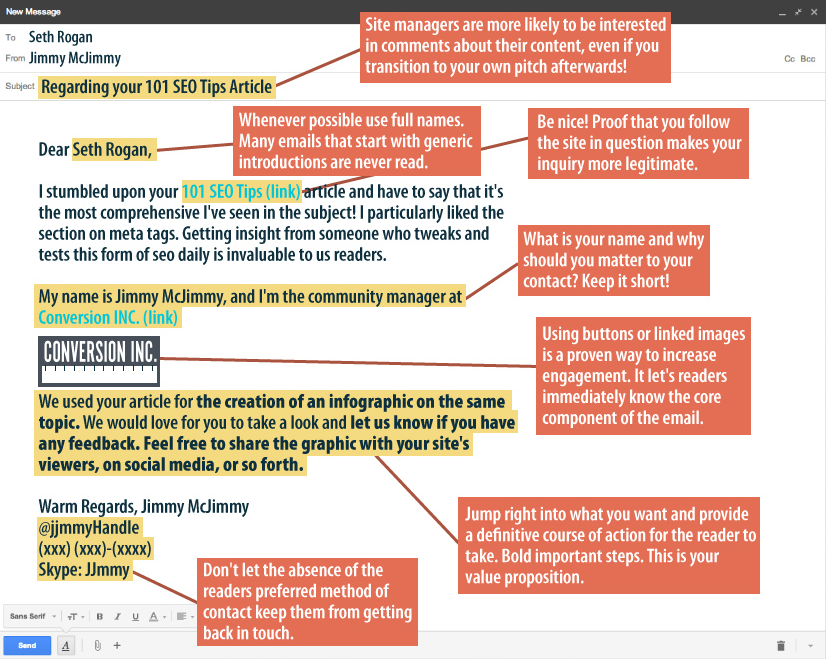
This data helps pave the way for any link-builder to craft the ultimate outreach email. We wanted to show off a quick example of how we took the data to craft a sample email. We broke the process down into 7 simple steps which anyone could follow for the email outreach process. Remember that the most effective email outreach is all about customization and personalization. Don’t feel pressured to follow a certain template, but learn from the insights as a guideline to the perfect email.
7 Steps for the perfect outreach email:
- Eye catching title: The title captures the readers attention because they will likely become aware the email is about something the content on their website.
- Specific personalized greeting: The email addresses the prospect by their full name “Seth Rogan”.
- Show interest in their work: Showing interest in the work makes it seem like you have genuine interest, and are not a random spammer or solicitor.
- Introduce yourself: What is your name, and who are you. Your position and expertise will serve as a trust enhancer.
- Use a Logo: The use of a logo serves as a trust enhancer and has been proven to improve response rates and closing.
- Value proposition: The the reader know what value you can provide them. This could be content partnerships, notifying them of how you’ve featured their work on your website, etc.
- Contact info: While leaving a phone number and social profiles have slightly lower response and closing rates, they might not be a bad idea to include sometimes.
Let us know in the comments down below how you’ve been changed your outreach email strategy for the New Year, and what has been working for you!


